Primary Energy Production
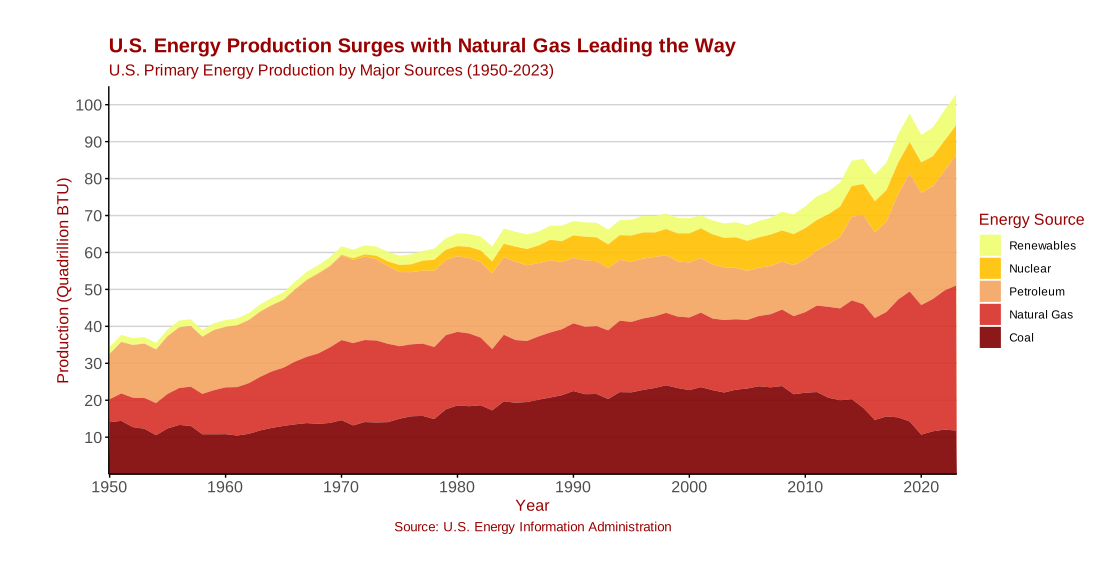
The chart belowshows a significant rise in total energy production, driven by the growth of natural gas and renewables. Natural gas experienced a sharp increase from the late 2000s due to the shale gas boom, while renewables have steadily grown since 2000, reflecting a slight shift toward cleaner energy sources. Coal, once a dominant energy source, peaked in the early 2000s but has since sharply declined due to environmental regulations and competition from natural gas. Nuclear energy grew rapidly between the 1970s and 1990s before stabilizing, while petroleum production has seen a resurgence in recent decades due to advances in extraction technology.
Primary Energy Consumption
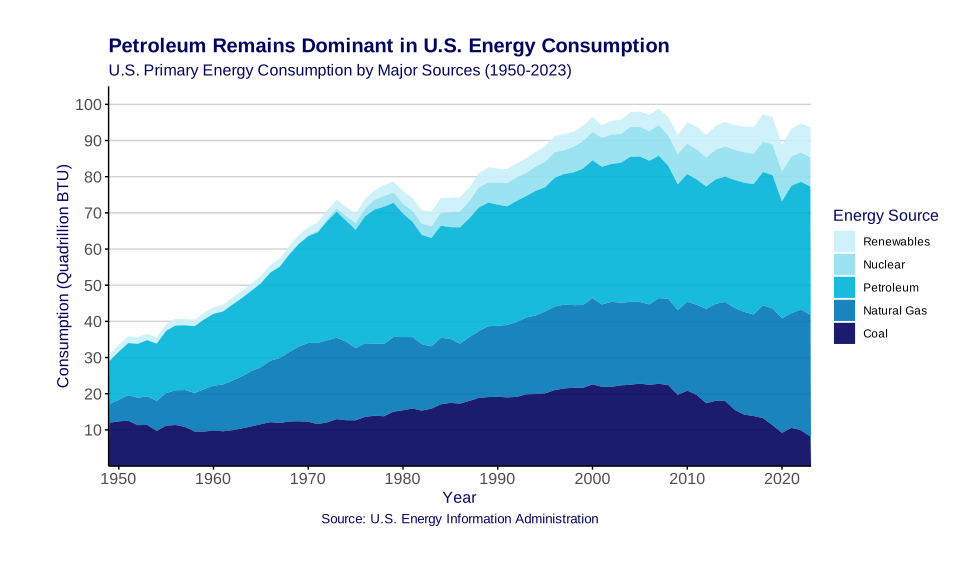
This chart showcases shifts in the nation's energy use over time. Petroleum remains the dominant energy source, driven by its use in transportation, despite gradual declines in recent decades. Natural gas consumption has grown significantly since the 2000s, reflecting its increased role in electricity generation and industrial use. Renewables, including wind and solar, have seen steady growth since 2000 as part of the transition toward cleaner energy. Coal consumption, however, has sharply declined since its peak in the mid-2000s due to environmental regulations and competition from natural gas and renewables. Nuclear energy consumption has remained relatively stable since the 1990s, reflecting limited expansion.
Renewable Energy Consumption
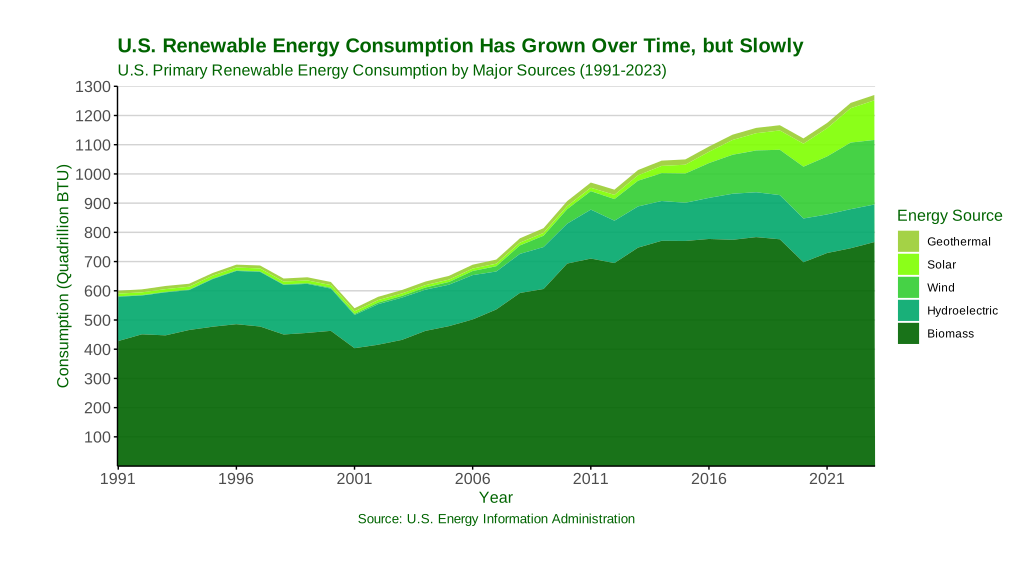
This graph illustrates the steady increase in U.S. renewable energy consumption from 1991 to 2024, driven by notable growth in solar and wind energy. Solar energy shows a particularly rapid rise starting around 2010, while wind energy also sees consistent gains. Biomass and hydroelectric energy remain significant contributors throughout the period but show relatively stable trends compared to solar and wind. Geothermal energy experiences moderate growth, reflecting its more limited role. Overall, the data highlights the diversification and expansion of renewable energy sources over the past three decades.
Renewable Energy Consumption by Sector
This section depicts the trends in renewable energy consumption across the residential, industrial, and electric power sectors in the U.S. from 1950 to 2023. In the residential sector, consumption experienced a significant decline until the 1980s, followed by a gradual recovery. The industrial sector shows a steady upward trend over the decades, reflecting consistent growth in renewable energy usage. The electric power sector, in contrast, exhibits a pronounced increase, particularly from the late 1990s, culminating in its dominance as the leading sector for renewable consumption. These trends highlight a sector-specific evolution in renewable energy adoption driven by technological advancements, policy changes, and economic shifts.